
Funding Futures Data Dashboard
Funding Futures Project Background:
Children from disadvantaged backgrounds too often start school already behind their peers, and these gaps frequently widen as they move through education and into adulthood. While this pattern is familiar nationally, some local areas are successfully bucking the trend and putting disadvantaged children on a much more positive trajectory.
With funding from Collective Futures, the Henry Smith Foundation and the Ethos Foundation, Mime have worked with Isos Partnership and the Education Policy Institute on a major early years project: Funding Futures.
The first stage of this project involved mapping local area disadvantage gaps and exploring how these change both over time and through different phases of education. A second stage involved selecting a range of local indicators of interest and, through both statistical modelling and fieldwork analysis, investigating which may be the strongest predictors of the size of the disadvantage gap, as well as how some local authorities are able to succeed in narrowing their disadvantage gaps ‘against the odds’.
This new set of research reports and online tools is designed for charitable funders, local authorities and policy makers who want to target resources in early childhood more effectively. Drawing on qualitative and quantitative evidence, the Funding Futures resources show how local areas can use funding, partnerships and data to improve outcomes for disadvantaged children. This is timely, as the government have recently set the first national target for improving outcomes at age five as part of the “Opportunity Mission” and have announced a three-year £1.5 billion package to support children to have the Best Start in Life (BSIL).
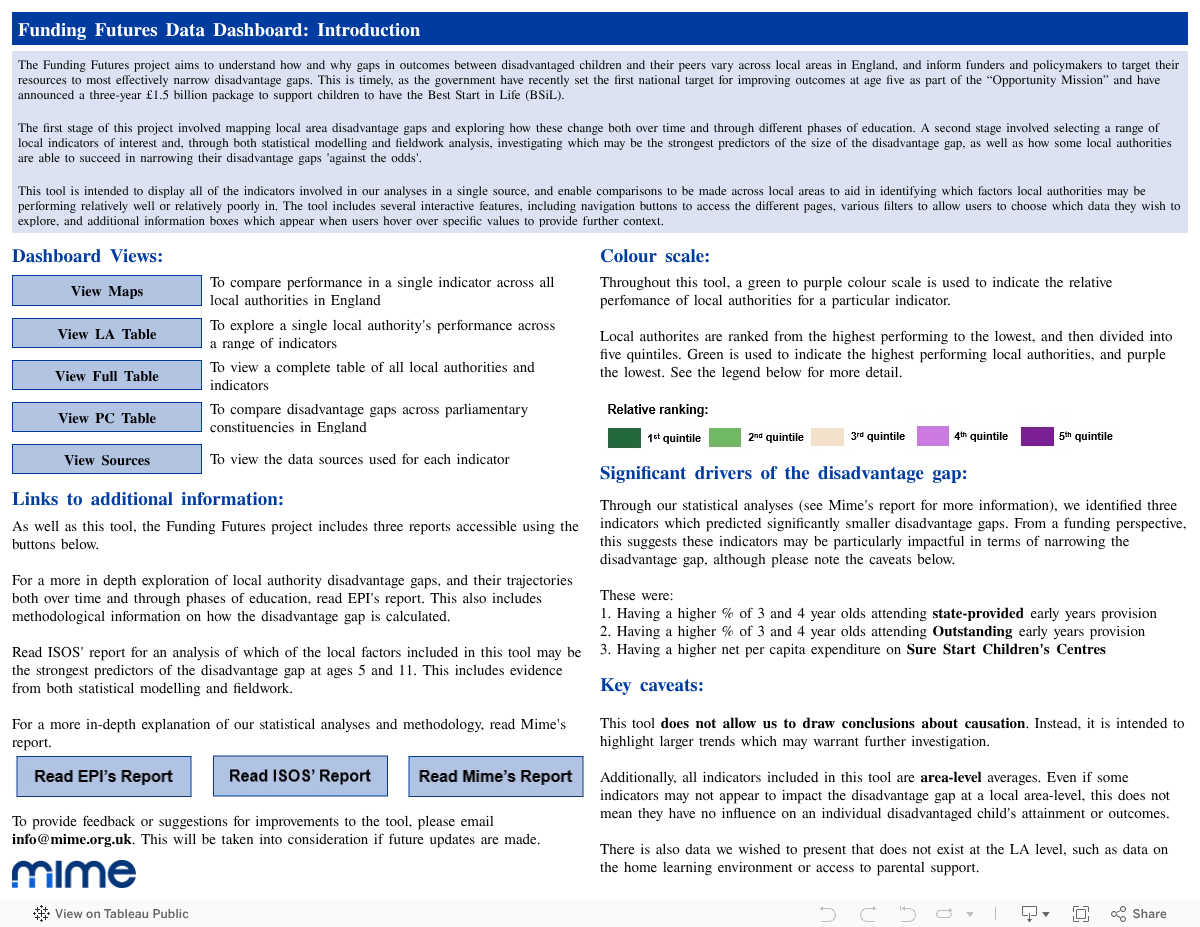
Funding Futures Data Dashboard:
To support local strategic planning, the Funding Futures data dashboard (above) brings together public data used in our regression analysis and shows how local authority characteristics relate to the size of the disadvantage gap. The dashboard is structured in three main parts to help users explore these relationships:
-
An England map to compare one indicator across all local authorities.
- An LA table to review a single local authority’s performance across a range of indicators.
-
A detailed heatmap providing a full table of local authorities and indicators, with the option to filter for statistical neighbours.
Together, these views allow users to understand their local context, compare themselves with similar areas and identify where there may be opportunities to learn from others. The dashboard includes several interactive features, including navigation buttons to access the different pages, various filters to allow users to choose which data they wish to explore, and additional information boxes which appear when users hover over specific values or icons to provide further context.
For a walkthrough of two of the dashboard pages, see the below clips from a webinar hosted by Mime and Isos Partnership. The full webinar is available here, and is targeted at demonstrating how the data dashboard can support local authority professionals in the development of their Best Start local plans and meeting the 2028 Good Level of Development targets.
Local Authority Table:
Full Table of Local Indicators:
Links to additional information:
As well as this tool, the Funding Futures project includes three reports accessible using the buttons below:
- Read EPI’s report for a more in depth exploration of local authority disadvantage gaps, and their trajectories both over time and through phases of education. This also includes methodological information on how the disadvantage gap is calculated.
- Read ISOS’ report for an analysis of which local factors included in this tool may be the strongest predicators of the disadvantage gap at ages 5 and 11. This includes evidence from both statistical modelling and fieldwork.
- Read Mime’s report for a more in depth explanation of our statistical analyses and methodology.
Key findings:
Through our statistical analyses (see Mime’s report for more information), we identified three indicators which predicted significantly smaller disadvantage gaps:
- Having a higher proportion of 3- and 4-year-olds in state-provided early years provision
- Having a higher proportion of 3- and 4-year-olds in Outstanding early years provision
- Having a higher net spend per capita on Sure Start children’s centres
From a funding perspective, this suggests these indicators may be particularly impactful in terms of narrowing the disadvantage gap, although please note the caveats below.
Caveats and limitations:
This dashboard does not allow us to draw conclusions about causation. Instead, it is intended to highlight larger trends which may warrant further investigation.
Additionally, all indicators included in this tool are area-level averages. Even if some indicators may not appear to impact the disadvantage gap at a local area-level, this does not mean they have no influence on an individual disadvantaged child’s attainment or outcomes.
There is also data we wished to present that does not exist at the LA level, such as data on the home learning environment or access to parental support.


