
Revised Key Stage 2 (KS2) performance data was published last Friday. This includes attainment and progress measures for reading, writing, and maths.
Across England, maths performance was markedly up on last year, while the percentage of pupils achieving the expected standard or above in reading has fallen. At a local authority level there is significant variation. The percentage of KS2 pupils reaching at least the expected standard in reading, writing, and maths ranges from 82% to 47%. In London, performance is strong, with half of London local authorities in the top 20 local authorities for the percentage of pupils achieving the expected or higher standard in reading, writing, and maths.
Headlines:
This data covers all KS2 pupils in state-funded schools in England:
- The percentage of pupils achieving the expected or higher standard in reading, writing, and maths (RWM) across England is 65%. The gender gap is 10% points, with girls outperforming boys. Regionally, the percentage of pupils achieving the RWM expected standard varies from 63% in the East Midlands, to 71% in outer London
- Across England, performance in reading fell, with only 74% of pupils achieving the expected or higher standard, and 27% reaching the higher standard, both down on last year. Regionally, the percentage of pupils achieving the expected or higher standard varies from 71% in Yorkshire and the Humber, to 78% in outer London. Average progress in reading varies from -0.5 in the East of England, to +1.1 in inner London
- The percentage of KS2 pupils in England reaching the expected or higher standard in maths has increased to 79% from 76% in 2018. Regional performance varies from 77% in the South West, to 84% in outer London. The South West has the lowest maths progress score at -0.6, compared to +1.2 in inner London
- The percentage of pupils at the expected or higher standard in writing is 78%, level with 2018. Regionally, writing performance varied the least of the three subjects, ranging from 77% in the East of England, to 82% in outer London. Writing progress scores range from -0.5 in the East of England, to +1.1 in inner London.
How well did your local authority perform?
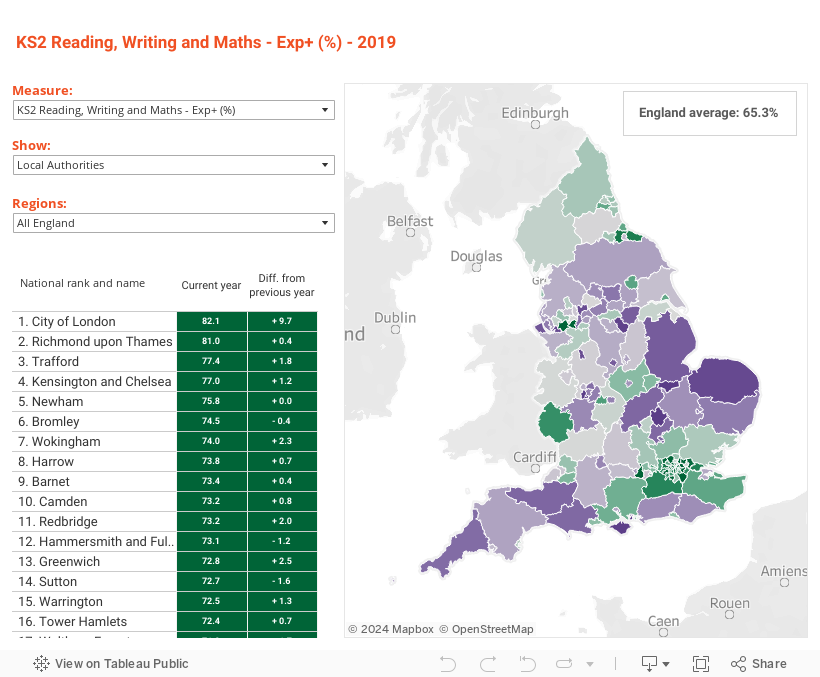
There is substantial variation in KS2 performance across the country. London local authorities tend to have higher percentages of pupils reaching the expected standard in reading, writing, and maths. Local authorities in the East Midlands and West Midlands are less likely to score highly. Find your local authority on our map to see KS2 performance in your area:
Figure 1: KS2 performance across England
RWM:
- Two local authorities have over 80% of pupils reaching the expected or higher standard in RWM. In 11 local authorities, this figure is under 60%
- Only two of the ten local authorities with the highest percentage of pupils achieving the expected or higher standard in RWM scores are outside London (Trafford and Wokingham).
Reading:
- The percentage of pupils achieving the expected or higher standard in reading ranges from 89.3% to 63.7%. Seven of the top ten are in London
- Of the ten local authorities with the best reading progress scores, only Trafford is outside London.
Writing:
- The percentage of pupils achieving at least the expected standard in writing in England, ranges from 88.5% to 68.4%
- Eight of the ten local authorities with the highest percentages are in London. None of the 60 local authorities with the lowest percentages are in London
- Writing progress scores range from -2.3, to +2.5.
Maths:
- Two local authorities have over 90% of pupils achieving the expected or higher standard in maths, and all but one achieved over 70%
- Nine of the ten local authorities with the highest percentage achieving the expected standard or above in maths are in London
- Five local authorities have maths progress scores over +2.0, while 11 have scores below -1.0.
The disadvantage gap – the London effect
Across all of the measures discussed above, there is a significant gap in performance between disadvantaged pupils and other pupils. Across England, the gap between disadvantaged pupils achieving the expected standard or higher in RWM, and other pupils is 20.0%. Only 51.5% of disadvantaged pupils achieved the expected or higher standard in RWM, compared to 71.5% of other pupils.
This gap is narrowest in London. Additionally, London’s success in narrowing the gap is down to higher attainment of disadvantaged pupils rather than lower performance among other pupils.
Figure 2: Disadvantage gap by region

The gap between disadvantaged and other pupils in both inner and outer London is smaller than in any other region. This is true of all three individual subjects as well as the RWM measure. Only 13.0% points fewer disadvantaged pupils in inner London achieve the RWM expected or higher standard than other pupils. The West Midlands is the only other region where the disadvantage gap is smaller than the gap across England as a whole. The South East and South West have the largest disadvantage gaps across all three subjects. These two regions also have the largest gaps for each individual subject.
Key finding: The gap between disadvantaged and other pupils is smaller in London than in any other region
Making this an even more striking finding is the fact that both disadvantaged and other pupils perform better in London than other regions. Performance of disadvantaged pupils in London is not just relatively better than elsewhere (closer to other pupils), but is also better in absolute terms.
Figure 3: Disadvantaged pupil performance

Looking at the actual performance of disadvantaged pupils reveals an even more stark London effect. 63.6% of disadvantaged pupils in inner London achieved the expected or higher standard in RWM, only a few percentage points off the figure for other (not disadvantaged) pupils in other regions. The smaller disadvantage gaps in inner and outer London are driven by stronger performance of the disadvantaged cohort, not by worse performance amongst other pupils.
Key finding: Disadvantaged pupils in London are far more likely to achieve expected or higher standards than those in other regions
Overall, while there is still a large attainment gap between disadvantaged and other pupils, London stands out as having a smaller gap than other regions. Further analysis could explore whether London’s relative success is a result of demographics, schooling practices, teaching, types of primary school, or something else. Interestingly, recent DFE analysis found that the ‘London effect’ remains even after controlling for demographics and socio-economic status.


