Transition matrices
Analysing progress from Key Stage 4 to Key Stage 5 Analysis, Insight Reports & InfographicsDashboards, Tableau & PowerBISchool ImprovementTableau Viz

Analysing progress from Key Stage 4 to Key Stage 5

As part of the Level 3 Value Add resources the Department for Education have released the Level 3 Transition Matrices for the Summer 2012 exam sitting. These are designed to show pupil progress from sub-levels of attainment at Key Stage 4 (GCSE or equivalent) to grade outcomes at Level 3 (A Level or equivalent) for a range of qualifications and subjects. We've presented this data interactively for you here. You start by choosing the qualification and subject combination from the drop-downs on the left and the grade outcomes pertaining to that qualification are presented as stacked bar charts split out…
Phil Rossiter
February 18, 2013
London SEN mapping tool
London SEN provider interactive map Analysis, Insight Reports & InfographicsDashboards, Tableau & PowerBILocal & Regional GovernmentSchool ImprovementTableau Viz

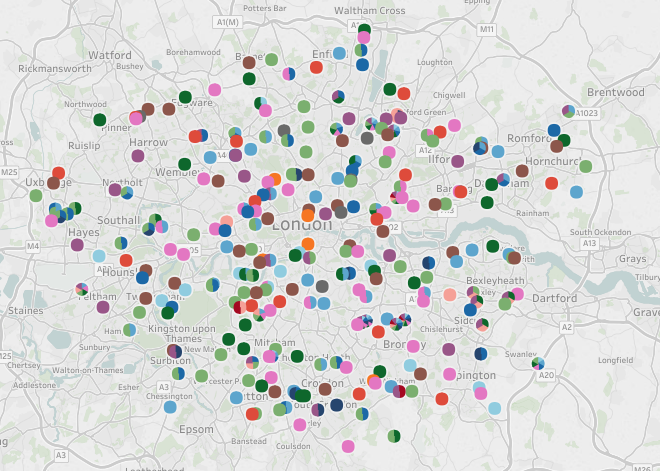
London SEN provider interactive map

We have created an interactive map of secondary schools and other institutions which deliver SEN provision in London. The tool has been built in Tableau so you can choose options such as selecting a particular type of SEN provision or selecting just a particular local authority. This was produced for London Councils are part of our LLDD (learners with learning difficulties or disabilities) Forecasting Project. Click here for our case study on this project. You can explore providers by local authority interactively in the tool here.
Phil Rossiter
December 13, 2012
;