Level 3 transition matrices – 2015/16 Analysis, Insight Reports & InfographicsDashboards, Tableau & PowerBISchool ImprovementTableau Viz

Level 3 transition matrices – 2015/16

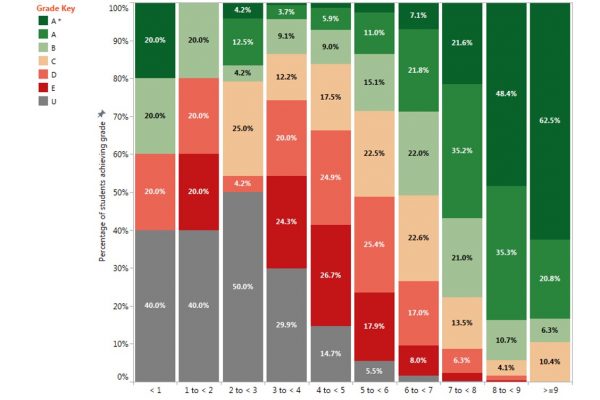
We have recently updated our popular Level 3 value-add visualisation, based on the latest DfE published data from 2016 results. The analysis shows pupil progress from average GCSE (and equivalent) prior attainment bands to different grades on Level 3 qualifications. The analysis spans A Levels, AS Levels and a wide range of other Level 3 academic and vocational qualifications, across a huge range of subjects. The interactive visualisation is available here.  Start by choosing the qualification and subject combination from the drop-downs on the left and the outcomes for that qualification are presented as stacked bar charts split out by…
Steve Preston
March 6, 2017
LSE interactive timeline
Tableau viz of the day Company NewsDashboards, Tableau & PowerBITableau Viz

Tableau viz of the day

Our recent Influential Academics timeline created in Tableau for the LSE British Goverment department has been selected by Tableau as 'Viz of the Day' for Tuesday May 28th! We built the visualisation as a dashboard allowing users of the British Government section of the LSE website to explore the history of various influential academics at the School across the eras its existence. The viz contains a summary of the academics career at the LSE, along with videos and cataloged research work. It's a good example of using Tableau as a 'front end' for data in addition to it being known…
Phil Rossiter
May 30, 2013
;