London Key Stage performance 2012-2014
Understanding London’s performance at Key Stage 5 Analysis, Insight Reports & InfographicsLocal & Regional GovernmentMime Think PiecesSchool Improvement

Understanding London’s performance at Key Stage 5

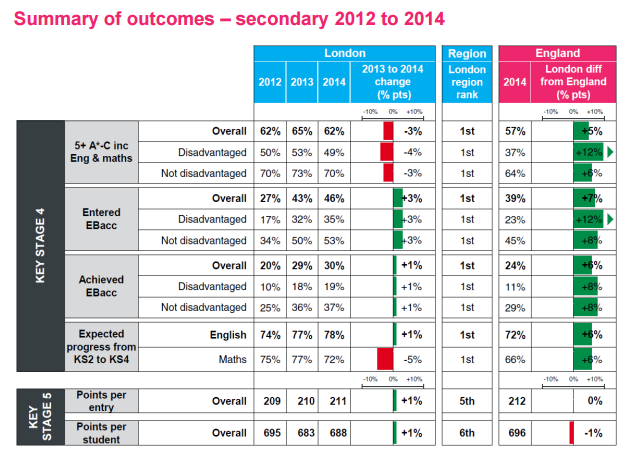
At Key Stage 4, London is the top performing region for the key attainment and progress measures. By key stage 5, that position slipped to 5th and 6th out of 9 regions.  As part of our work on the GLA annual education report for 2015, we reviewed the underpinning data to understand the causes. We found 4 interesting facts: Lower prior attainment - London schools are more likely to accept lower performing Key Stage 4 pupils into post-16 provision, especially on vocational courses. Whilst these pupils go on to achieve a full level 3 qualification, they are less likely to…
Steve Preston
January 12, 2016
Childcare Expo logo
EYFS Tracker at the Childcare Expo – March 2014 Company NewsSchool Improvement

EYFS Tracker at the Childcare Expo – March 2014

The EYFS team will be attending the Childcare Expo at Kensington Olympia on the 28th and 29th of March. This will be a great chance for us to meet new and existing users of the EYFS Tracker as well as finding out about other companies and products. The event is free to attend for anyone working in the Early Years and Childcare Sector and we will be offering FREE one to one training sessions for existing users. For a limited time only we will also be offering a 10% exhibition discount for any school or setting that signs up using the promotional…
Steve Preston
January 10, 2014
EYFS logo
EYFS Tracker at the 2013 Childcare Expo Company NewsSchool Improvement

EYFS Tracker at the 2013 Childcare Expo

Last week we had a great couple of days on our stall at the Childcare Expo in Coventry meeting new and existing users of the EYFS Tracker. The event was really well attended and we had lots of interest in the Tracker from schools, nurseries and childminders alike. It was also a great opportunity to meet other companies working in the childcare sector, including potential partners (as well as looking for toys for our kids!) Thanks to Broadway Events for organising such a successful event.
Steve Preston
October 4, 2013
Transition matrices
Analysing progress from Key Stage 4 to Key Stage 5 Analysis, Insight Reports & InfographicsDashboards, Tableau & PowerBISchool ImprovementTableau Viz

Analysing progress from Key Stage 4 to Key Stage 5

As part of the Level 3 Value Add resources the Department for Education have released the Level 3 Transition Matrices for the Summer 2012 exam sitting. These are designed to show pupil progress from sub-levels of attainment at Key Stage 4 (GCSE or equivalent) to grade outcomes at Level 3 (A Level or equivalent) for a range of qualifications and subjects. We've presented this data interactively for you here. You start by choosing the qualification and subject combination from the drop-downs on the left and the grade outcomes pertaining to that qualification are presented as stacked bar charts split out…
Phil Rossiter
February 18, 2013
NFER logo
Assessing children’s progress in primary schools Analysis, Insight Reports & InfographicsSchool Improvement

Assessing children’s progress in primary schools

Our Director, Steve, was recently invited by NFER to contribute to a group discussion on the strengths and weaknesses of the systems used to assess the progress of pupils in primary schools. Despite some flaws in the existing system, it was stressed that there is an important place for data and analysis when part of a national framework. However, it is unwise to look solely at attainment figures as this fails to account for the starting abilities of children in some areas and the idea that progress should play a central role in this data analysis is clearly important. Steve…
Steve Preston
January 17, 2013
London SEN mapping tool
London SEN provider interactive map Analysis, Insight Reports & InfographicsDashboards, Tableau & PowerBILocal & Regional GovernmentSchool ImprovementTableau Viz

London SEN provider interactive map

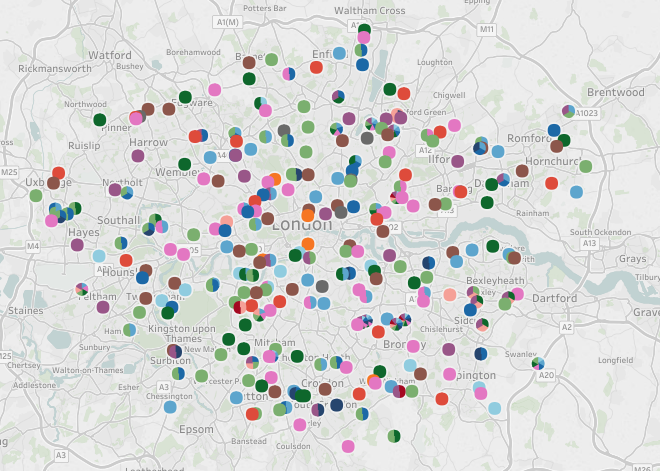
We have created an interactive map of secondary schools and other institutions which deliver SEN provision in London. The tool has been built in Tableau so you can choose options such as selecting a particular type of SEN provision or selecting just a particular local authority. This was produced for London Councils are part of our LLDD (learners with learning difficulties or disabilities) Forecasting Project. Click here for our case study on this project. You can explore providers by local authority interactively in the tool here.
Phil Rossiter
December 13, 2012
Year 1 phonics check
Year 1 Phonics Check – How important is reaching the 32 point threshold? Analysis, Insight Reports & InfographicsSchool Improvement

Year 1 Phonics Check – How important is reaching the 32 point threshold?

We have just supported a number of schools in analysing the outcomes of the recent, controversial, Year 1 Phonics Check. The Phonics Check measures a 5 or 6 year olds’ reading level in terms of their ability to “decode phonics” (including fake words such as yop and groiks). The outcomes for schools will not be publically available, and so schools will not be directly held to account for their pupil’s achievement in the check; however, what can our analysis tell us about how important teachers consider their pupil’s scores? Well, the expected level for the check is 32 points (out…
Steve Preston
July 23, 2012
Gfted and talented in primary schools
Why does being born in the Autumn make you more likely to be gifted or talented? Analysis, Insight Reports & InfographicsSchool Improvement

Why does being born in the Autumn make you more likely to be gifted or talented?

Most of us working in education are aware of the impact that a child’s term of birth has on their academic development, particularly in primary schools (in Year 1, the oldest child in the year has experienced 20% more development than the youngest). However, why does that extend to the identification of gifts or talents, which should surely be independent of age? Historically, schools were required to inform the DfE about the individuals they had identified as Gifted and Talented (G&T). Using this data, as part of our work for G&T regional partnerships, we identified that a primary school child…
Steve Preston
January 16, 2012