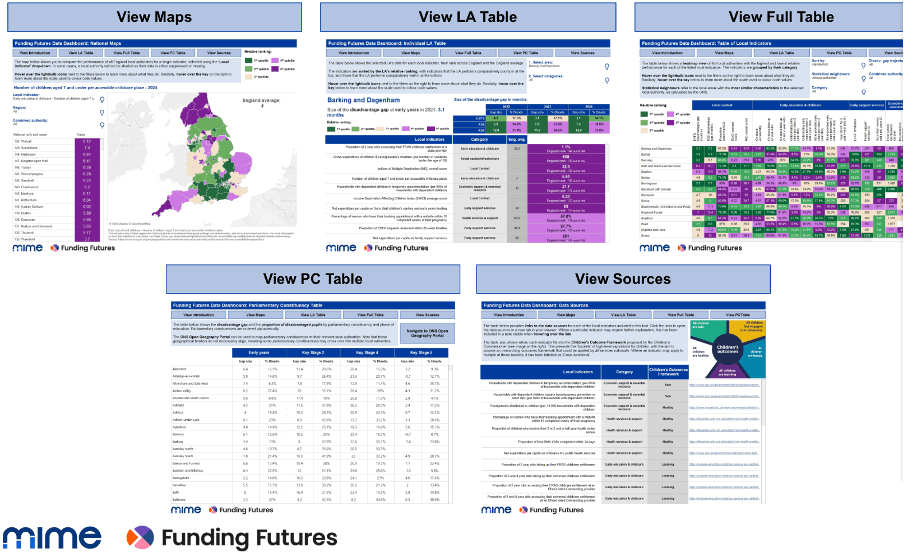
The Funding Futures dashboard brings together early years data and research in one place, helping charities, funders, local authorities and researchers compare areas, understand local patterns, and make better decisions for babies, children and families. This guide explains how to get the most from the dashboard and its supporting resources.
Quick guide to using the Funding Futures Dashboard
- Compare your local authority with others across England.
- Explore early years data through maps, tables, and interactive filters.
- Understand the factors associated with children’s outcomes.
- Support strategic planning, commissioning, evaluation, and funding decisions.
- Access research alongside the data for additional context.
Every organisation working to improve outcomes for babies, children and families requires evidence to understand local needs and decide where resources can make the greatest difference. The challenge is often bringing together information from different sources, understanding what it means, and applying it to local priorities.
The Funding Futures resources were created to help address that challenge.
Developed in partnership by Mime, Isos Partnership and the Education Policy Institute, and funded by Collective Futures, Henry Smith Foundation and Ethos Foundation, Funding Futures draws together data and research in a series of reports combining both statistical modelling and qualitative fieldwork. As part of the project, Mime produced a free dashboard that brings together the public data the underpins the research. Instead of searching across multiple national datasets, users can compare local authorities across England, explore a wide range of indicators, and build a clearer picture of the factors shaping children’s outcomes.
Whether you’re developing strategy, planning services, preparing a funding application or deciding where resources could have the greatest impact, the dashboard provides a practical starting point for understanding your area.
This supporting guidance has been updated to help both new and returning users get more from the dashboard. In this guide, we explain key features, answer common questions, and make it easier to find the information you need.
How to use the Funding Futures dashboard
1. Start with your question
The dashboard works best when you begin with a clear question.
You might want to understand how your area compares with similar local authorities, explore a particular measure or investigate regional variation. Starting with a question helps you focus on the evidence that’s most relevant to your work.
2. Choose the best view of the data
The dashboard offers three ways to explore the data:
- national maps
- local authority tables
- full table of all the indicators available.
Each view supports a different way of working. Some users prefer to begin with a map to identify broad patterns, while others want to compare individual authorities, or work directly with the underlying data.
Each view supports a different way of working. Some users prefer to begin with a map to identify broad patterns, while others want to compare individual authorities, or work directly with the underlying data.
3. Use the colours to understand what you’re seeing
The dashboard uses colour coding to group local authorities for many measures.
For each indicator, local authorities are ranked from the highest performing to the lowest performing and grouped into five quintiles. Green represents the highest-performing group and purple the lowest-performing group for that measure.
4. Apply filters to explore your data
The dashboard includes filters that help you focus on the data most relevant to your work. Hover over the lightbulb icon beside each filter to display additional guidance and explanation of what the filter is.
For example, a charity operating in a particular region could compare local authorities within this area to understand any differences in local contexts. A council might compare its position with statistical neighbours to identify any opportunities for learning from similar local areas. A funder or researcher could explore local areas succeeding against the odds in narrowing their disadvantage gaps to examine potential drivers behind this success. The dashboard makes it much easier to answer these kinds of questions without manually bringing together data from multiple sources.
Looking beyond the numbers
One of the key findings from the Funding Futures research is that there is rarely a single explanation for why some places achieve stronger outcomes for children than others. Local circumstances are shaped by many interacting factors. The dashboard is designed to help users explore how those factors relate to one another rather than viewing them in isolation. Combined with local knowledge and professional judgement, the evidence provides a stronger foundation for planning, discussion and decision making.
Frequently asked questions
What is the Funding Futures dashboard?
The Funding Futures dashboard is a free online resource that combines early years data and research in one place. Developed by Mime, it helps charities, funders, local authorities and researchers compare areas, understand local patterns and support evidence-informed decision making.
Who is the Funding Futures dashboard for?
The dashboard is designed for anyone working to improve outcomes for babies, children and families who wants to better understand local need, compare areas across England, and use evidence to inform planning and investment.
Where does the data come from?
The dashboard brings together data from a range of national datasets used to understand children’s outcomes and the factors associated with them. This includes data from the DfE on early years outcomes and provision, healthcare data from Public Health England and local authority expenditure figures from Section 251, among others. The accompanying research explains the measures, their sources and how they should be interpreted.
Is the Funding Futures dashboard free to use?
Yes. The dashboard, supporting research and user guidance are all available free of charge. You can access them here.
When will the Funding Futures dashboard next be updated?
The next update is planned to take place in August, and will include new data for most measures as well as a new section of the dashboard allowing in-depth exploration of early years outcomes data broken down by area of learning and pupil characteristics. This will be followed by a second update later this year which will include the EYFSP outcomes data for 2025/26.
Explore the dashboard and related resources
Ready to get started?
- Explore the Funding Futures dashboard to compare local authorities and explore early years data.
- Read the Funding Futures research to understand the evidence behind the dashboard and the factors associated with children’s outcomes.
- Discover more about how Mime supports charities, funders and local authorities with data analysis, benchmarking and evaluation
Whether you’re exploring Funding Futures for the first time or returning with a new question, we hope these resources help you find the evidence you need, interpret it confidently and apply it to local decision making.