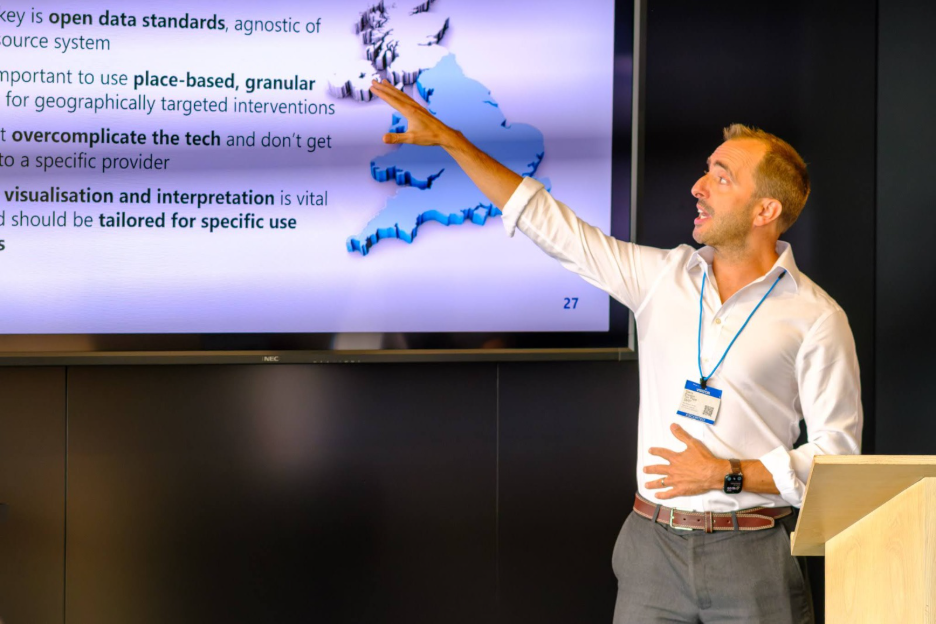
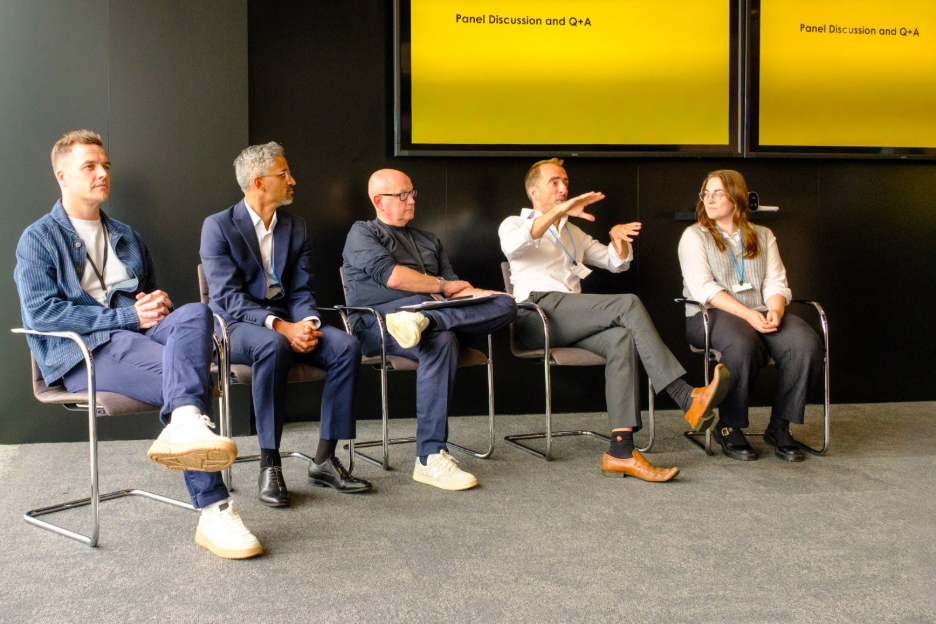
Mime recently joined Future of London’s From Data to Decisions workshop, alongside colleagues from London boroughs, housing associations, planning and regeneration.
Our presentation focused on a familiar challenge for many public sector organisations: there is a huge amount of useful data available, but it is often held across different systems, published in inconsistent formats or reported at different geographical levels.
We discussed how bringing this information together can help teams build a clearer picture of local needs and use evidence to inform planning and decision-making. The aim is not to replace professional judgement or local knowledge, but to give teams a stronger and more consistent evidence base.
We looked at public data sources including the Census, Explore Education Statistics and Public Health Fingertips, alongside government, local authority and organisational data. Used together, these sources can provide insight that may be difficult to see when each dataset is considered in isolation.
We shared examples of how similar analytical approaches can be applied across different service areas:
- identifying patterns of need across localities to help inform housing and service planning
- helping children’s services understand local differences and consider how provision is planned
- comparing skills supply with employment demand across local authority areas
- exploring local patterns that may help inform social prescribing services
- examining educational inequalities across and within local authorities
- bringing together information on cost-of-living pressures and the support available locally
A key part of the discussion was the practical work needed to make data useful. This can include standardising information from different sources, linking data across geographical areas, checking data quality and making appropriate assumptions (including interpolation and extrapolation) where data is not available at the level you are operating at.
We also discussed the importance of presenting findings in a way that suits the audience. A dashboard, infographic or short insight report may all use the same underlying data, but the right format depends on the question being asked and how the information will be used.
The main takeaway from the session was seeing how the same data models and analytical methods can support different departments across local authorities. Housing, education, employment, public health and children’s services may have different priorities, but they often face similar questions about local need, service planning and how best to use the data already available.
It was valuable to discuss these shared challenges with people working across different parts of London’s built environment and public services.
Thank you to the Future of London team and everyone who contributed to the discussion.