If you work in early years, local government, the charity sector or public services, having good local data matters. But finding it, checking how up to date it is and comparing it across different places is not always straightforward.
That’s exactly what the Funding Futures Data Dashboard is designed to help with.
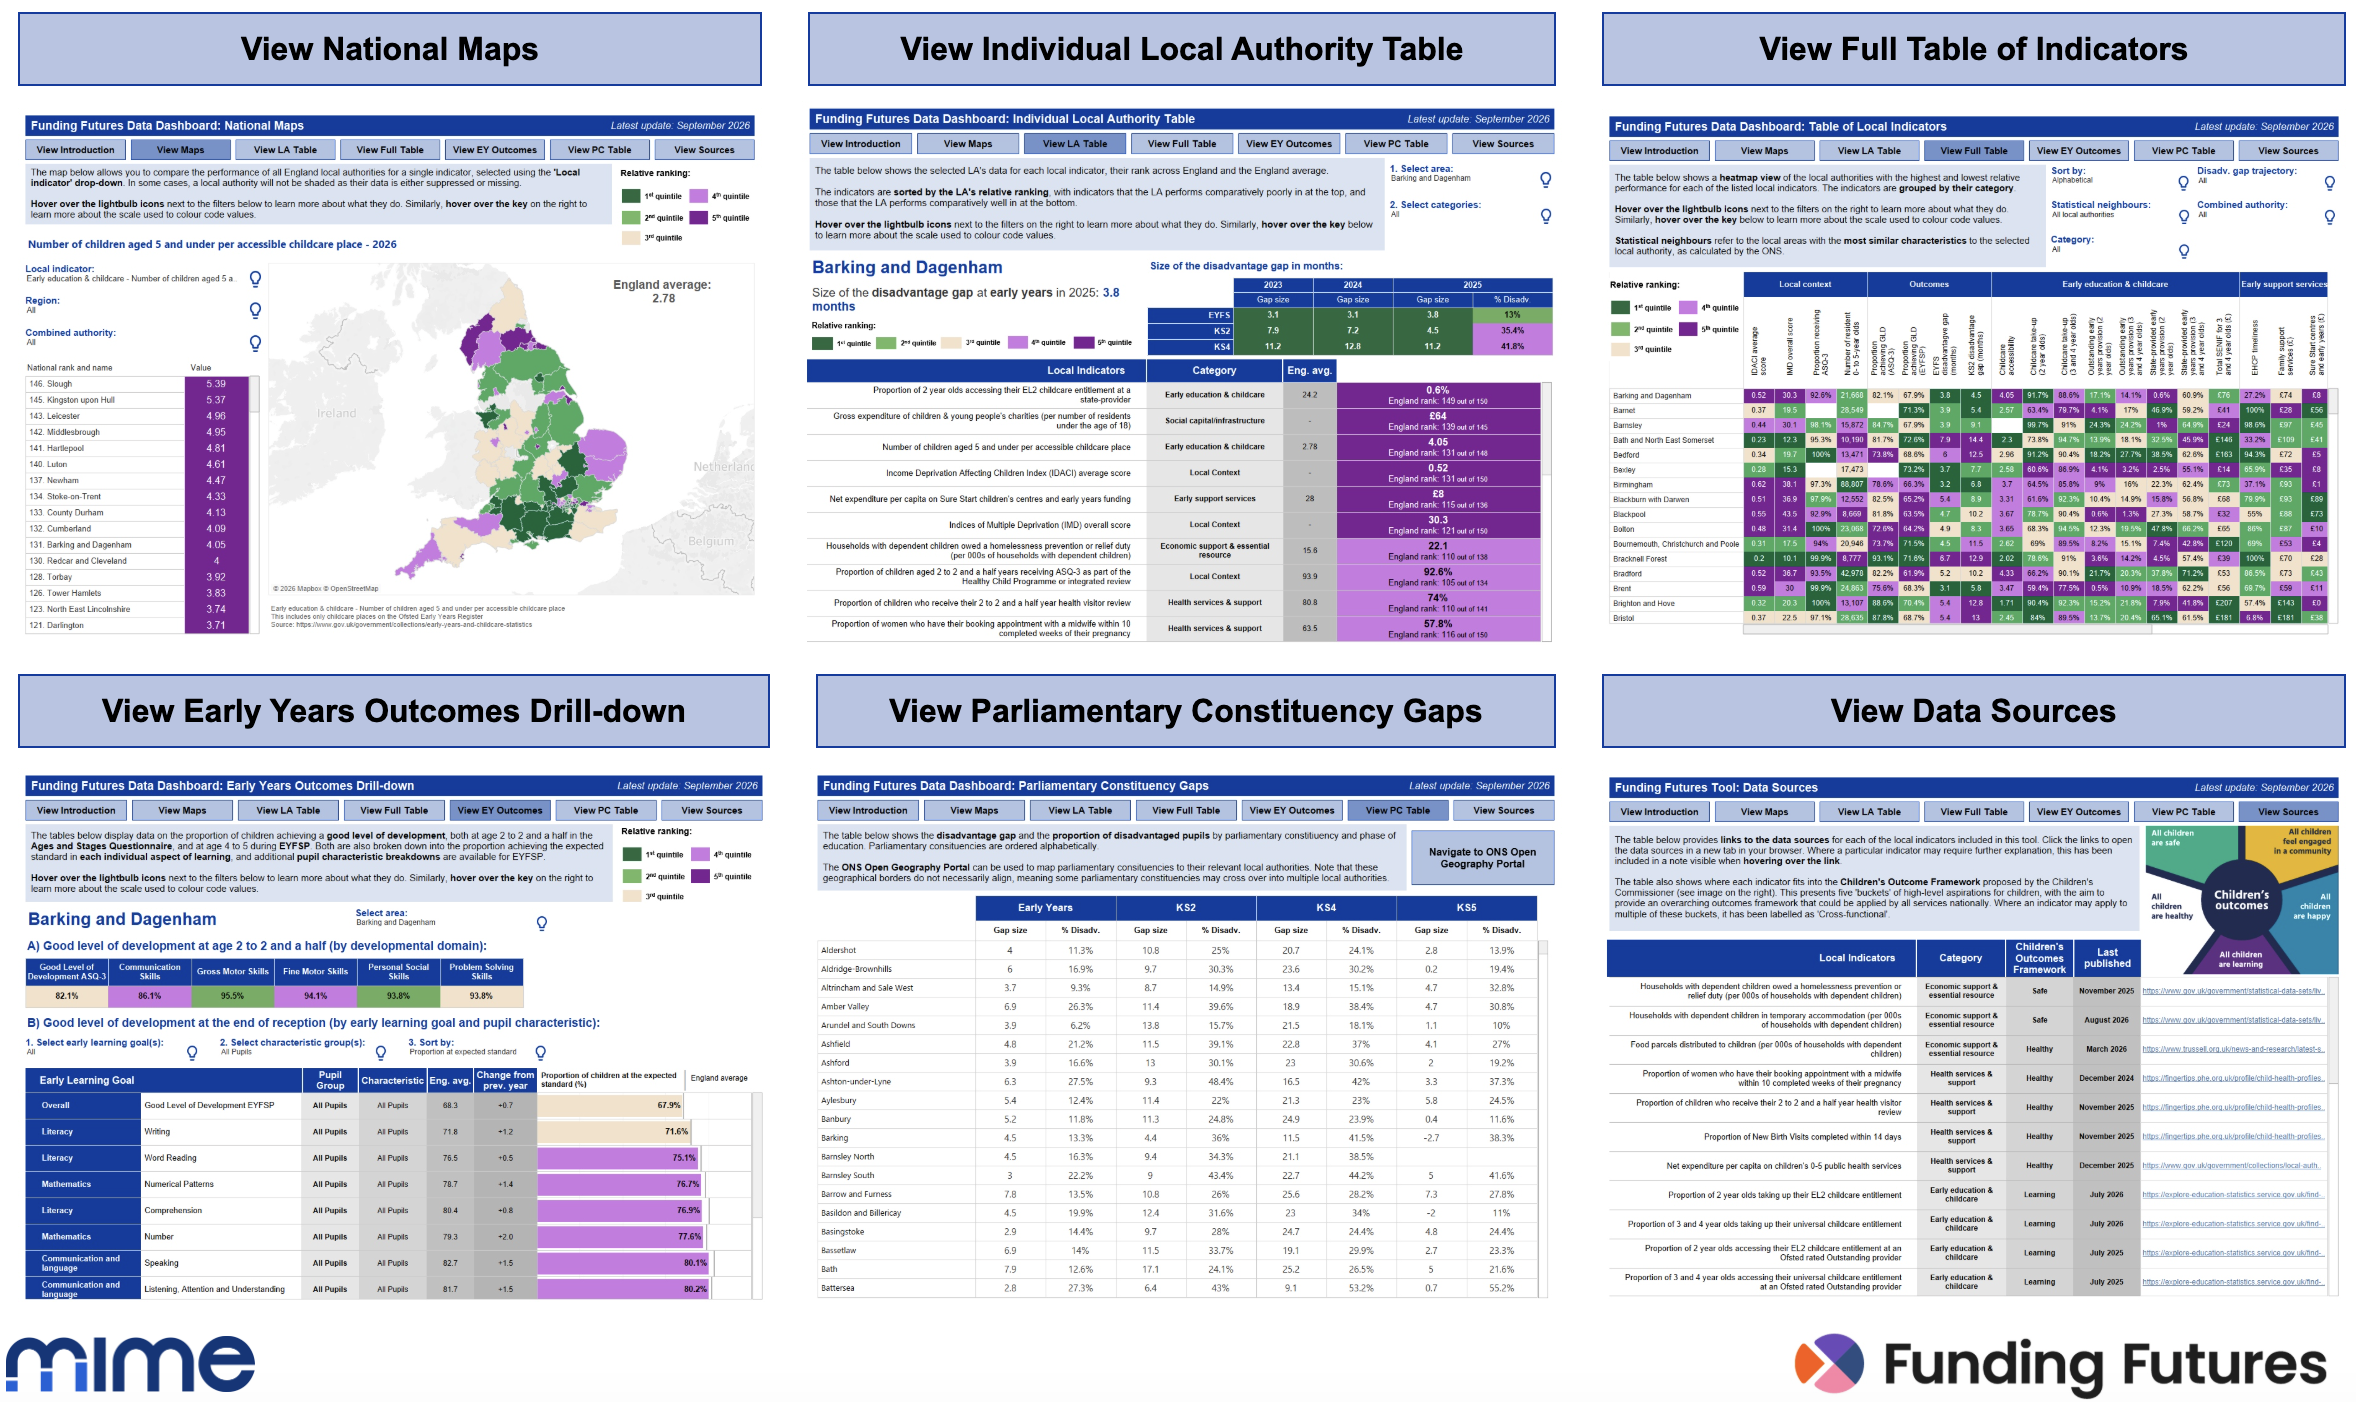
The dashboard brings a wide range of early years and local area data together in one place, making it easier to understand what is happening locally, compare areas and explore the factors that may be linked to differences in outcomes for disadvantaged children.
We’ve now updated the dashboard with refreshed data, clearer information about the sources, and a new section that allows users to explore early years outcomes in more detail.
What’s new?
Where possible, the datasets used in the dashboard have been updated with the latest available information. This includes new data on early years outcomes and disadvantage gaps, take-up of early years provision, budgets for support services, and the accessibility of healthcare and economic resources.
We’ve also added a new ‘latest publication’ column to the Data Sources table.
This means you can quickly see when each dataset was most recently published, making it easier to judge how current the information is without having to check every source individually.
The biggest addition is a new section focused on local early years outcomes.
You can now explore the proportion of children achieving a good level of development:
- at ages 2 to 2½, in the Ages and Stages Questionnaire administered during health visitor reviews
- and at ages 4 to 5, in the Early Years Foundation Stage Profile assessed at the end of Reception
This new section allows you to compare outcomes for children in your local area to national benchmarks, giving context to your performance. Outcomes can also be compared to your performance in the previous year, helping you to track changes over time.
You can also look more closely at performance across individual areas of learning, including reading, writing, communication skills and motor control. This can help you identify the specific skills children in your local area are struggling with the most, supporting you to design targeted interventions.
For Early Years Foundation Stage Profile data, outcomes can also be explored by pupil characteristics, including gender, ethnicity, SEND status and eligibility for free school meals. This allows you to compare differences in performance across pupil groups, and identify those who may benefit from additional support.
A clearer picture of what is happening locally
Headline figures are useful, but they rarely tell the whole story.
The updated dashboard makes it easier to look beneath those overall numbers and explore where differences may exist.
For example, you might want to understand:
- how outcomes in your area compare with other local authorities
- whether particular areas of learning stand out
- whether outcomes differ between pupil groups
- how your area compares with similar places
- which issues might be worth exploring in more detail locally
The dashboard does not provide all the answers, and the data should not be used to assume that one factor directly causes another.
What it can do is help you spot patterns, ask better questions and build a stronger evidence base for local conversations.
How can the dashboard help?
The Funding Futures Data Dashboard can be useful for a wide range of people working across early years, charities, local government and the wider public sector.
You might use it to:
- build a clearer picture of your local area
- compare your area with others
- explore differences in early years outcomes
- support planning and priority setting
- identify areas for further research or discussion
- bring evidence into conversations about services, funding and support
The aim is to make complex data easier to access and easier to use.
Rather than searching across lots of different sources, the dashboard brings the information together so you can spend more time exploring what it might mean for your area.
About Funding Futures
The Funding Futures project aims to understand how and why gaps in outcomes between disadvantaged children and their peers vary across local areas in England.
The work is intended to support funders, policymakers and local decision-makers to think more carefully about where resources could have the greatest impact.
Mime have developed the Funding Futures Data Dashboard over the past couple of years, working with Collective Futures and the wider project team to turn complex data into a practical, accessible tool. As the project has evolved, we’ve continued to develop and refine the dashboard so it remains useful for the people who rely on it.
The latest updates are part of that ongoing work, making the evidence easier to explore through more up-to-date data and a more detailed view of early years outcomes.